
25 January 2022

Jian Ma
Hitachi China Research Laboratory, Hitachi (China) Ltd.
In my previous blog, “Applying motor ability tests to fall risk assessment to help improve QoL,” I wrote about how we used a mathematical tool, Copula Entropy (CE), to discover the relationship between finger motor ability and functional ability in aging people as part of our efforts to realize better elderly care. In this blog, I’d like to talk about a CE based method for Variable Selection (VS), a method which can help select the “right” variables more effectively and help derive better interpretations without sacrificing accuracy performance.
Variable selection is important in the classification and regression task in machine learning and statistical applications where both predictability and interpretability are required. Scientific modeling is an art that prefers law of parsimony (or called Occam’s razor), and VS is such a traditional fundamental problem in statistics and machine learning with wide applications in different other fields.
When building a model for a given problem, we need to choose the inputs and output of the model. In many situations, there are a huge number of candidate variables for inputs and one target variable for output but only a subset of candidate variables is useful. As its name suggests, the VS problem is to select a subset of candidate variables as inputs to the model. The goal of the problem is to reduce the complexity, and improve the efficiency, of the model to make the final model both with high predictability in real use and interpretable for users.
For example, when making diagnosis for patients, doctors can measure the status of patients with many clinical tools but only a few measures may be useful for diagnosing a type of disease. So, they should select the measures relevant to the disease out of which to make a diagnosis. Later, we will show such an example for heart disease diagnosis.
There are already many existing methods for VS, such as Akaike Information Criteria (AIC), Bayesian Information Criteria (BIC), LASSO, and association measures including traditional Pearson correlation coefficient or recently introduce Distance Correlation (dCor) and Hilbert-Schmidt Independence Criteria (HSIC), etc. However, they are all with their own drawbacks and are only applicable with theoretical limitations. Especially in cases where interpretability is needed, they fail. So, here we proposed to use Copula Entropy (CE) to solve this problem instead. We demonstrated its power against existing methods with real-world data.
CE is defined as a measure of multivariate statistical independence with copula theory and proved to be equivalent to mutual information in information theory [1]. It enjoys advantages over traditional association measures. It is a perfect measure with several good properties that other measures don’t have, including multivariate, symmetric, non-positive (0 iff independent), invariant to monotonic transformations, and equivalent to correlation coefficient in Gaussian cases. It is the measure statisticians have long been dreaming of since the birth of statistics. So, it is also an ideal tool for VS. In my previous article, we introduced its application to fall risk assessment.
Here we introduce how to solve VS with the CE. The idea is simple and clear: first, the negative CE between a target variable and candidate variables are estimated from data, and then a subset of candidate variables is selected for modeling according to the value of negative CE. The larger the negative CE, the better the candidate variable.
VS with CE has several merits. It is model-free which means researchers don’t have to know anything about the underlying system when applying the method, and hence universally applicable to every system. If properly implemented, it is also tuning-free which means developers can use it directly without bothering things like (hyper-)parameter-tuning. It makes interpretable models instead of black-box models because CE itself has rigorous mathematical and physical meanings and hence end-users can understand why the model built with it works. In a word, it is a science of VS with sound and universal theory and method, instead of art with tips and tricks like other methods.
To demonstrate the power of the proposed method, the famous UCI heart disease dataset [2] is used in our experiments, which contains four databases about heart disease diagnosis collected from different locations worldwide. The dataset contains 76 raw attributes for clinical variables, including the attribute for diagnosis of patients’ disease and other 13 attributes for biomedical measurements which are recommended by professionals as clinically relevant, such as serum cholesterol, fasting blood sugar, resting electrocardiographic results, etc. These recommended variables will serve as a gold standard for evaluating the VS methods.
We tested both the traditional methods and the CE method on the dataset to select variables and make models which predicted diagnosis results from the selected clinical variables. The traditional methods include AIC, BIC, GLMs, and two independence measures (dCor and HSIC). The variables were selected first and then the predictive models were built with the selected variables. To evaluate the methods, we will check which model presents high predicting accuracy and is also interpretable.
The experimental results are listed in Table 1. We can see that the CE based method presents the highest accuracy among the traditional methods. We then check the interpretability of the models by counting how many recommended variables are selected. This time, CE did better again than all the other methods with 11 out of 13 recommended variables selected as shown in Figure 1.
| Model | Accuracy (%) | # Recommended variables |
|---|---|---|
| SVM (CE) | 84.76 | 11 |
| SVM (dCor) | 82.76 | 9 |
| SVM (dHSIC) | 84.54 | 10 |
| Stepwise GLM (AIC) | 51.8 | 8 |
| LASSO | 79.2 | - |
| Ridge Regression | 63.0 | - |
| Elastic Net | 75.9 | - |
| Adaptive LASSO | 35.7 | 4 |
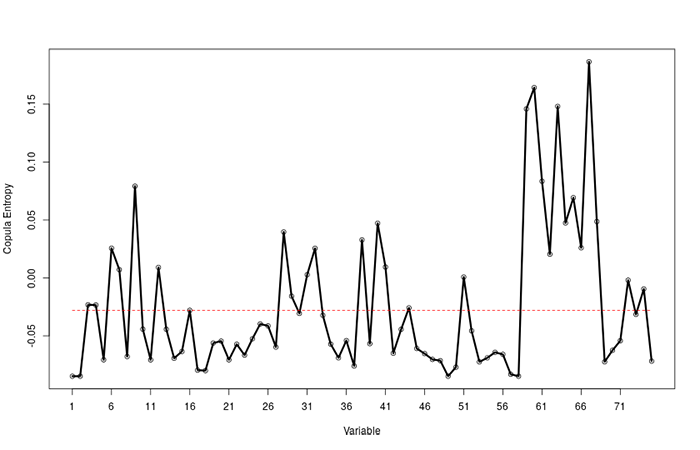
Figure 1. The result by the CE method. The variables above the red line are selected.
We proposed a method for VS with CE and showed its advantage over existing methods with the UCI heart disease dataset where the better new results were obtained in terms of predictability and interpretability.
To find out more, I invite you to read our paper titled “Variable selection with copula entropy” published in the Chinese Journal of Applied Probability and Statistics [3].